Discover and share the places that keep you cool in Toronto! From shaded underpasses to breezy green spaces, your submissions will help shape a growing community map of urban relief and resilience.
As summer heat intensifies, shade becomes more than a comfort; it becomes a public resource. Cool Spots invites Torontonians to share their favourite places to cool down across the city: spaces that make urban life more livable during increasingly hot summer seasons. From leafy parks and splash pads to overpasses and tucked-away laneways, these places of thermal refuge are often hidden in plain sight.
Please follow these guidelines to keep things cool and respectful for all users:
- Click on the map to locate your cool spot (ensure your cool spot is public!)
- Give it a name, the time of day you use it, and write a short description.
- Your cool spot will be reviewed by a moderator and added to our cool spots map.
What our moderators will do:
- Ensure your cool spot is in public.
- Ensure descriptions don’t contain profanity or inappropriate content.
- Ensure no personal information is shared.
Please note that this tool adheres to The Bentway’s privacy guidelines and does not collect or store any personal information.
Double click to explore user-submitted cool spots! Map updated daily. Click to view in browser ->
Shade is an essential public resource, how can we distribute it equitably?
Cities have long grappled with extreme heat and recognize the vital and democratizing role that shade and other cooling strategies play: offering much needed shelter; creating places to gather safely; and growing community resilience. In this project, we conceptualize these cooling strategies and spaces in a wider framework.
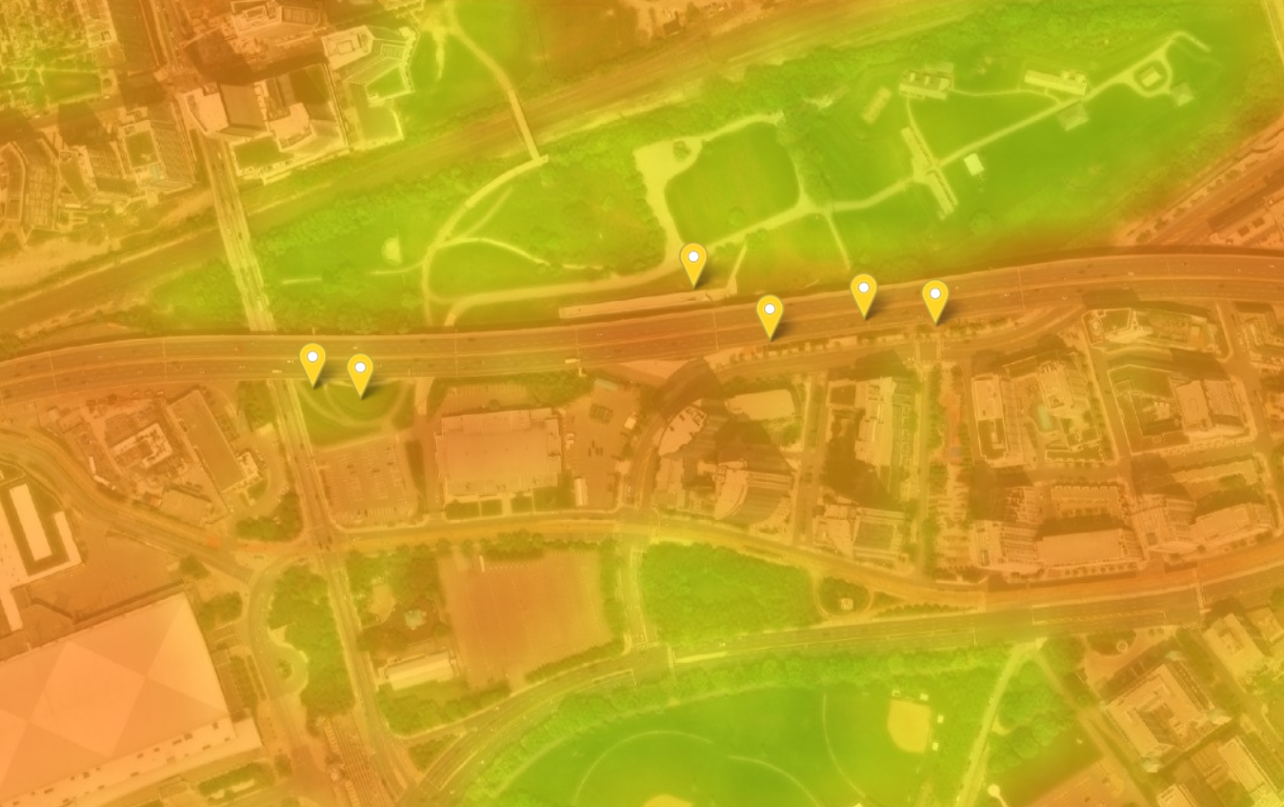
Climate change is expected to bring more than 60 days per year of temperatures above 30°C in Toronto by 2040–2045. That’s nearly triple the number recorded from 2000 to 2009. This warming is intensified by the urban heat island effect, where dense clusters of pavement, buildings, and concrete trap heat and raise temperatures in cities significantly higher than surrounding rural areas.
Cool Spots takes inspiration from international precedents like Toronto’s Cool Spaces Near You, New York City’s Cool Neighbourhoods, and Barcelona’s Cool Walks. Each highlights the value of crowdsourced, community-based knowledge in identifying and protecting spaces of relief in the city.
Closer to home, the Gardiner Expressway serves as Toronto’s largest continuous canopy, offering impactful potential for adaptive reuse as a source of thermal relief. As our city adapts to rising temperatures and longer summers, these shaded areas become increasingly important not just as places of relief, but as sites of community gathering, climate adaptation, and everyday life. Cool Spots engages our community to identify places of refuge under and beyond the Gardiner, helping the city adapt to rising temperatures and define new spaces for civic life.
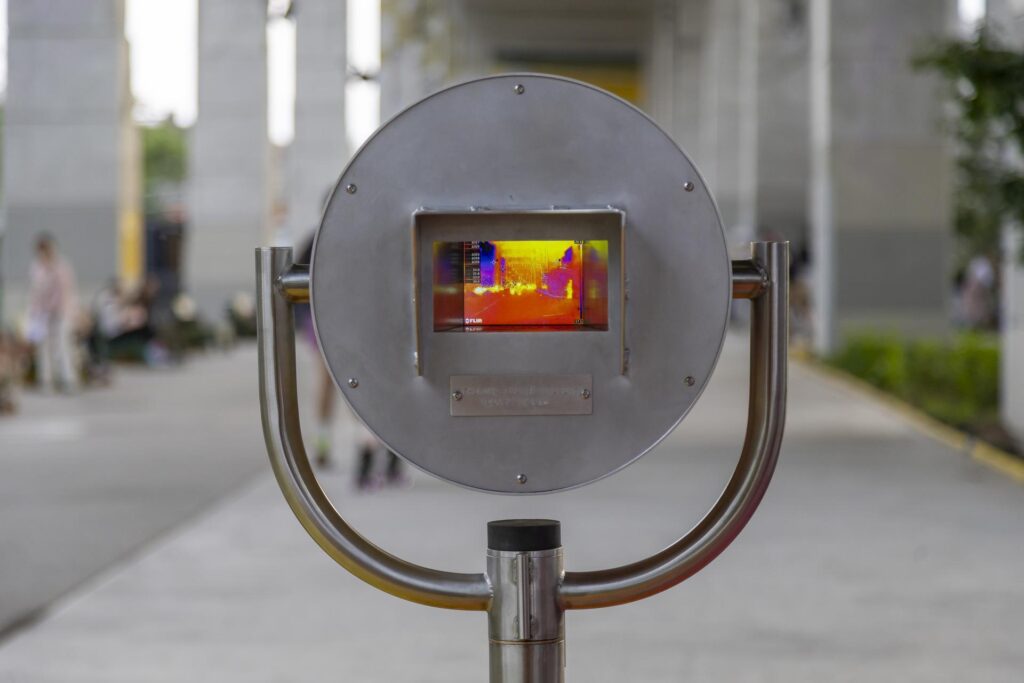
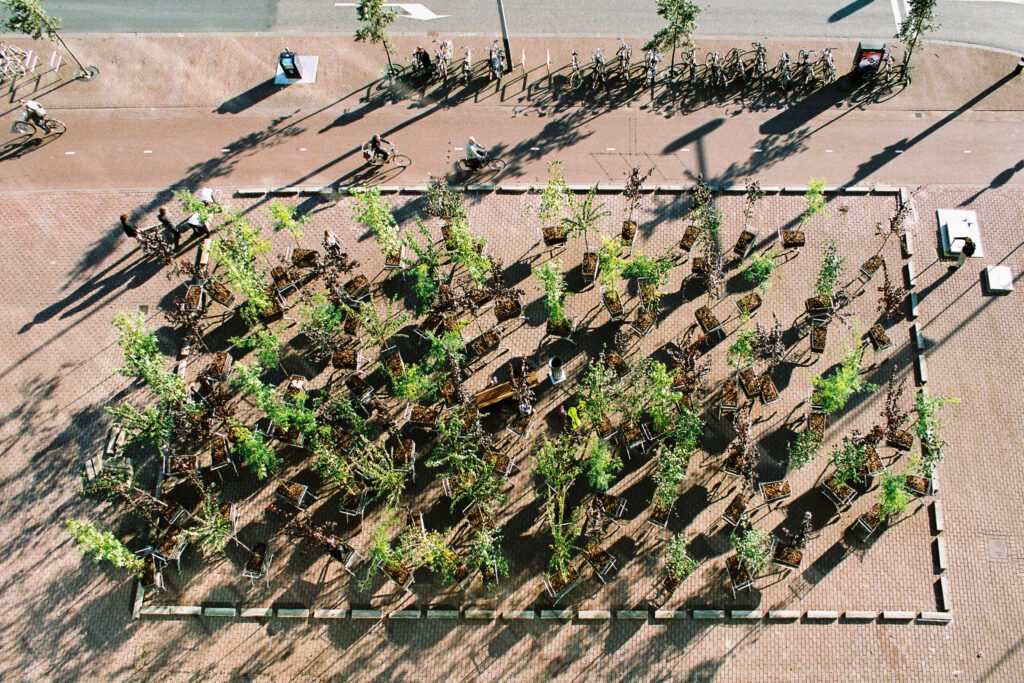
The initiative is part of The Bentway’s Sun/Shade season, which invites artists, designers, and researchers to shine a light on the benefits of shade and reimagine how we can experience public space. This season’s artists shine a light on the benefits of shade and explore new relationships with the sun. This season’s artists prompt us to explore our cities through a new lens, and now we invite you to do the same and join the conversation!
where do you go to stay cool?
Do you seek shelter under a tree? In an air-conditioned space? Do you go to your neighbours or community for support? Share your Cool Spot on this map to help build a more comfortable, climate-resilient Toronto.
Click to submit your cool spot! Click to view in browser ->
project team
G.I.S. Production: Kyra Meier
Web Developer: Graham Powell
Concept & Design Development: Josh Harskamp
Data sources:
- Urban Heat Island: Landsat 8 Surface Reflectance Tier 1 Collection 2 [Dataset]. Retrieved from Google Earth Engine: https://developers.google.com/earthengine/datasets/catalog/LANDSAT_LC08_C02_T1_L2
- OpenStreetMap contributors. OpenStreetMap. Retrieved from https://www.openstreetmap.org
- Esri. World Imagery [Basemap]. Retrieved from https://www.arcgis.com/home/item.html?id=10df2279f9684e4a9f6a7f08febac2a9
- Regional Municipal Boundary [Shapefile]. Information & Technology Division, City of Toronto. (no date). https://open.toronto.ca/dataset/regional-municipal-boundary/
Research footnotes:
- Toronto Environment Office. Toronto’s Future Weather & Climate Driver Study: Outcomes Report. Summary of the SENES Consultants Ltd. Study, City of Toronto, 30 Oct. 2012. PDF file, https://www.toronto.ca/wp-content/uploads/2018/04/982c-Torontos-Future-Weather-and-Climate-Drivers-Study-2012.pdf.
- Read more about the open mapping movement
- Read more about Citizen Science
- We used Leaflet to develop this project.